When you split your budget by CPM, money flows to wherever impressions are cheapest, not necessarily to where people actually pay attention. One real campaign showed us how big that gap can be.
Case study: four channels, one yardstick
Our client, a Czech online retailer of premium cookware and kitchen equipment, ran a brand video campaign from October 2025 to mid-January 2026 with one goal: grow brand awareness.
The video ran on YouTube, on open-web video inventory bought through DV360 (OLV), and on Facebook and Instagram. DV360 and YouTube alone reached over 2.4 million unique users.
For every channel we used Adelaide to measure how much attention the ads actually earned (the AU score), and converted the price into the cost of one unit of attention.
This metric is called CPAU and the maths is simple: CPM ÷ average AU. The lower the CPAU, the more attention you get for your money.
|
CHANNEL
|
CPM
|
AVERAGE AU
|
CPAU
|
|
YouTube
|
CZK 113.17
|
71.70
|
CZK 1.58
|
|
Online video on the open web (OLV)
|
CZK 79.66
|
41.18
|
CZK 1.93
|
|
Facebook
|
CZK 75.90
|
18.95
|
CZK 4.01
|
|
Instagram
|
CZK 139.74
|
27.42
|
CZK 5.10
|
CPAU = cost per attention unit. Source: Adelaide, brand video campaign, Oct 2025 – Jan 2026.
If CPM were the deciding metric, Facebook would win. Convert the price into attention and the ranking flips.
On average, Facebook ads earned only a quarter of the attention YouTube ads did, so a unit of attention cost CZK 4.01 there. On YouTube, where impressions were 49% more expensive, it cost just CZK 1.58.
This was not a one-off. All four channels landed within 3% of Adelaide’s benchmark for their channel, so the gaps reflect how these channels generally perform in Adelaide’s data. If you buy a similar mix, there is a good chance they apply to your budget too.
How we measure attention, and why it holds up
Adelaide gives every impression an AU (Attention Unit) score. It expresses how likely an ad in a given placement is to capture attention and drive an outcome, such as brand recall. The model is trained on real campaign outcomes.
In 2025, its methodology was independently reviewed by the advisory firm MediaSense, which confirmed that higher AU reliably correlates with stronger awareness, recall and purchase intent.
We compared several tools before choosing one. We went with Adelaide because it measures channels, formats and devices with one comparable metric, including YouTube and social platforms.
Same CPM, different attention: devices matter
Looking inside YouTube tells an even clearer story. CPM was practically the same on every device, at around CZK 113. Attention was not:
|
DEVICE (YOUTUBE)
|
CPM
|
AVERAGE AU
|
CPAU
|
|
TV (connected TV)
|
CZK 113.86
|
80.83
|
CZK 1.41
|
|
Desktop
|
CZK 112.99
|
73.44
|
CZK 1.54
|
|
Tablet
|
CZK 111.92
|
65.30
|
CZK 1.71
|
|
Mobile
|
CZK 113.02
|
65.22
|
CZK 1.73
|
Source: Adelaide, YouTube part of the campaign.
For the same price, ads on a TV screen earned 24% more attention than on a phone.
Through a CPM lens every device looks the same, so without attention measurement this difference would have stayed hidden.
The campaign also included non-skippable 15-second spots built for connected TV. Their CPM was higher than the campaign’s other YouTube ads (CZK 127.62), but with an AU of 71.97 their cost per unit of attention came to CZK 1.77. That is less than half the cost of attention on Facebook.
Why one number is not enough
If we went by CPAU alone, Instagram would be the first channel cut: it had the most expensive attention of all four (CZK 5.10). Yet for the same campaign, Meta estimated a higher ad recall lift on Instagram than on Facebook: 6.89% versus 4.24%.
The explanation is simple. According to Adelaide, AU deliberately does not rate the creative or the audience, only the quality of the placement.
That is why we always pair attention with impact measurement. In this campaign, that meant a YouTube Brand Lift study comparing people who saw the ad with a control group:
- Brand awareness rose by 9.9 percentage points (control group: 8.2%).
- The lift was higher among women (+12.3 pts) than men (+8.7 pts).
- Non-skippable spots on connected TV showed a +14.8 pt lift after a manual calculation. The sample was too small to be statistically significant, so we treat it as a signal only.
Brand Lift and Adelaide point the same way: non-skippable TV spots performed well on attention and, based on early data, on awareness too.
One number tells you what is cheap. Only a combination of measurements shows where your budget works hardest.
What it means for your budget
Imagine you have CZK 100,000 for a brand video campaign. At this campaign’s prices, here is what it would buy:
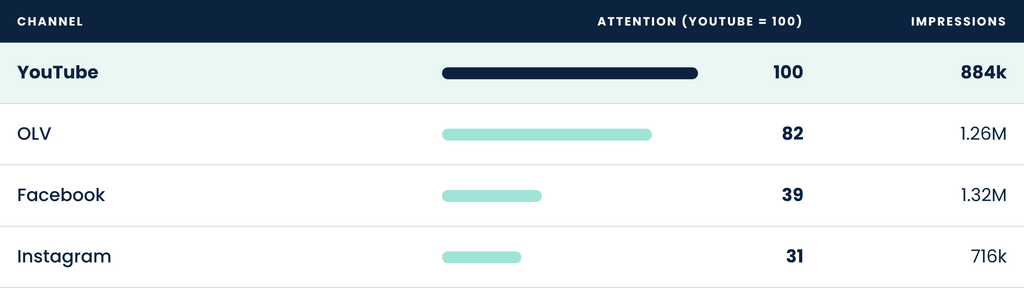
Calculated from this campaign’s CPM and CPAU, for a CZK 100,000 budget.
For the same money, Facebook gives you 50% more impressions than YouTube, but less than half the attention. If you split your budget by CPM, you buy volume that looks great in a report but carries less attention.


