Does your brand campaign sell? Prove it.

The campaign is over, reach is delivered and Brand Lift says awareness went up. Then the CFO asks how much it sold. Here is how we answered that for a fashion e-commerce brand in Poland, with a Causal Impact study.

Brand builds awareness. The CFO asks about sales.

The main job of a brand campaign is to build awareness and make the brand easier to remember and choose. That is how we plan and evaluate them: reach, frequency, attention and Brand Lift.

But awareness is not the end goal. Companies invest in brand because, over time, it makes people buy more. That long-term effect is real, and it is hard to measure. 

When the finance director asks how much the investment added to sales, “awareness went up 5 points” is not an answer they can put in a spreadsheet.

The full long-term effect of brand will always be larger than what you can measure in a few weeks. What you can measure is the short-term impact on conversions: how many purchases happened during the campaign that would not have happened without it.

That is what a Causal Impact study shows. It doesn’t replace Brand Lift. It adds the number the CFO is asking for.

Who it is for: Marketing managers who need to show what a brand campaign did for sales.
Brand Lift shows people remember you. A Causal Impact study shows they bought.

Why last-click can’t see it

A YouTube video, a banner on a news site or a Spotify spot rarely leads to an immediate click and purchase. 

People see the ad, remember the brand a week later, type its name into Google or straight into the browser, and buy. Analytics credits the sale to brand search or direct traffic, and brand looks like a cost rather than an investment.

So we ask a different question. Not “how many conversions are attributed to the campaign”, but “how many purchases would have happened without it, and what is the difference from reality”.

Watch out: Brand search and direct traffic take the credit for sales a brand campaign started.

What a Causal Impact study is, without the maths

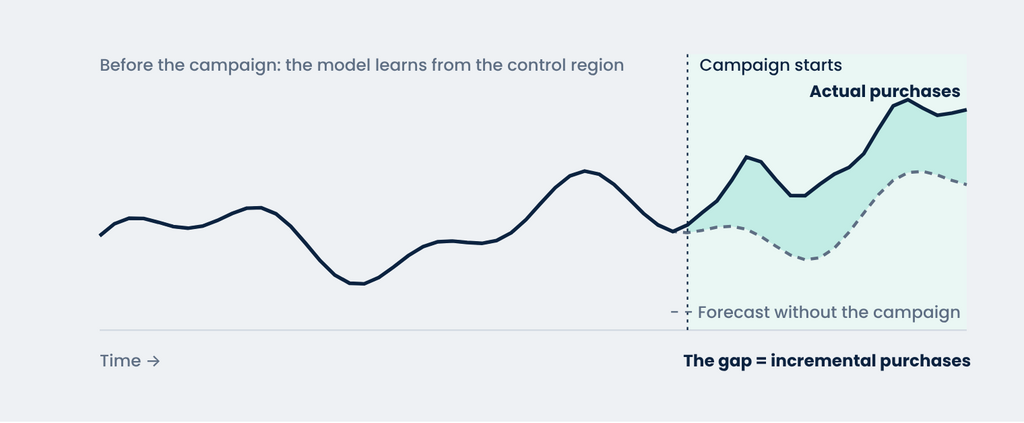
Causal Impact is a statistical method originally developed at Google. From historical data, the model builds a parallel world: a forecast of how purchases in a campaign region would have developed if the campaign had never run. 

To build it, it uses a region where the campaign did not run but which historically behaves the same way.

The gap between the forecast and reality is the incremental effect of the campaign, together with the probability that it isn’t down to chance. Preparing the test is more than half the work.

llustration. The forecast follows the control region, so whatever the market does anyway is already in it. Only the gap is credited to the campaign.

llustration: The forecast follows the control region, so whatever the market does anyway is already in it. Only the gap is credited to the campaign.

We have run Causal Impact studies for our clients since 2019. The lesson that stuck: the result is only as good as the test design.

The case: A fashion e-commerce brand builds its brand in Poland

Our client, a fashion and streetwear e-commerce brand, ran a brand campaign in Poland in spring 2026: YouTube, programmatic display and video in DV360, Meta, TikTok and Spotify, aimed at 18 – 34-year-olds. 

The goal had two parts: grow awareness, and prove that brand has a measurable effect on sales.

We designed the measurement before the campaign started, in three steps.

Weeks, spring 2026

6

Target audience

18-34

Channels: YouTube, DV360, Meta, TikTok, Spotify

5

Test pairs of regions

3

01 Decide where to invest

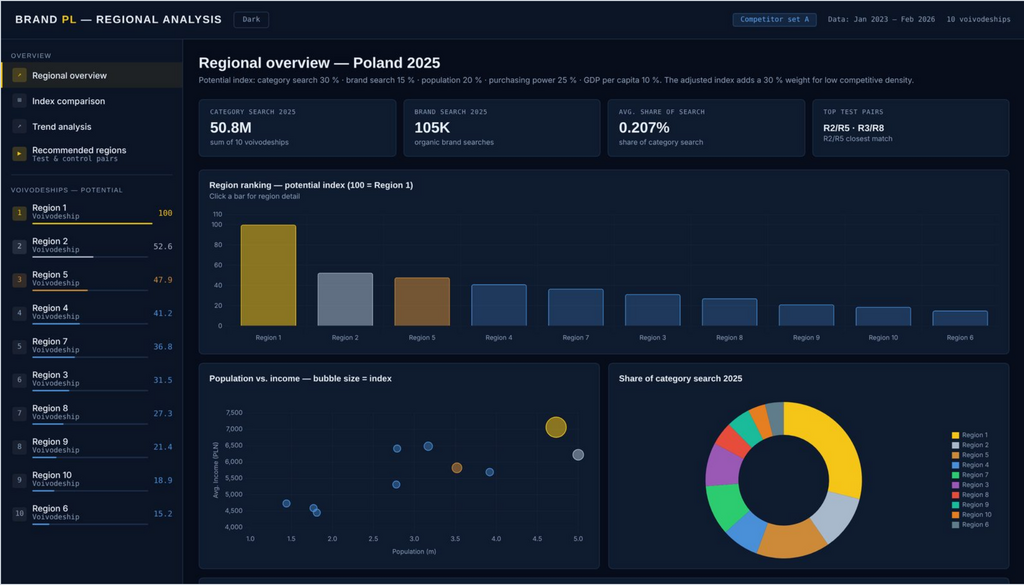
Poland has 16 voivodeships, and each is a different market. Before we talked about measurement, we scored the potential of every region on the points below. 

To protect the client’s data, we call the regions Region 1, Region 2 and so on, and the figures in the screenshots are illustrative.

  • size and trend of search demand for sneakers and streetwear,
  • the brand’s share of search against its main competitors, from large fashion marketplaces to specialist stores,
  • population, purchasing power and GDP per capita,
  • the client’s actual orders from GA4 by region.

The result was a potential index and an interactive dashboard we used with the client to choose where the campaign would run.

Our regional segmentation dashboard. Each voivodeship gets a potential index built from search demand, brand search, population, purchasing power and GDP per capita, adjusted for how crowded the market is. Region names and figures are anonymised.

Our regional segmentation dashboard. Each voivodeship gets a potential index built from search demand, brand search, population, purchasing power and GDP per capita, adjusted for how crowded the market is. Region names and figures are anonymized.

Useful surprise: Some regions sell far more than their brand search suggests. A loyal customer base can react to brand advertising differently than a cold market.

02 Find each region a twin

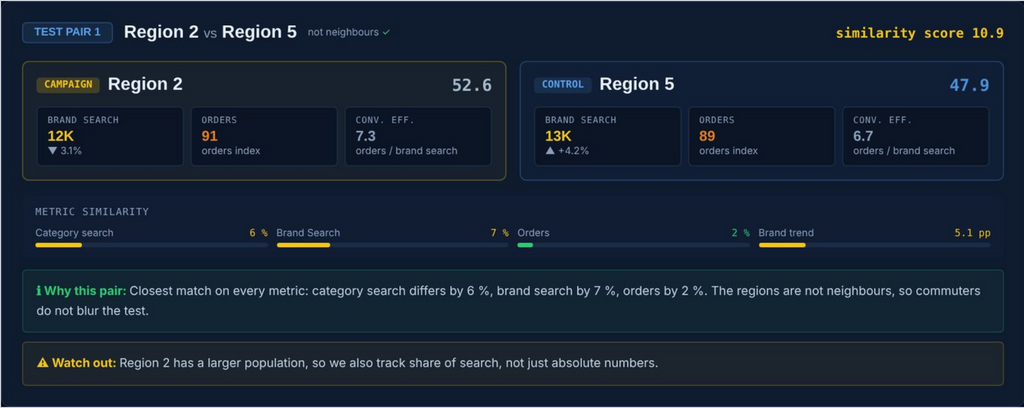
For a fair test, every campaign region needs a twin: a region that has historically behaved as similarly as possible but where the campaign does not run. We followed three rules.

  • Similar data. Category search, brand search, number of orders and trend.
  • No neighbours. Twins must not share a border, so people commuting between regions don’t blur the test.
  • A clean test. No other local activity runs in these regions during the campaign.

This gave us three pairs: Region 2 vs. Region 5, Region 3 vs. Region 8, and Region 6 vs. Region 10. 

Figure 3 · One of the three test pairs. Region 2 and Region 5 differ by only a few percent in category search, brand search and orders, and they are not neighbours. Figures are illustrative.

One of the three test pairs. Region 2 and Region 5 differ by only a few percent in category search, brand search and orders, and they are not neighbours. Figures are illustrative.

No twin, no proof: For four campaign regions, including the two largest markets, no region was similar enough. We told the client up front and tracked them as an indication only. 

03 Measure

For the six weeks of the campaign, mid-March to the end of April, we pulled daily GA4 data by region: purchases, revenue and add-to-carts. For each test region, the model compared reality with a forecast built on its control twin.

The main result: The brand campaign sold

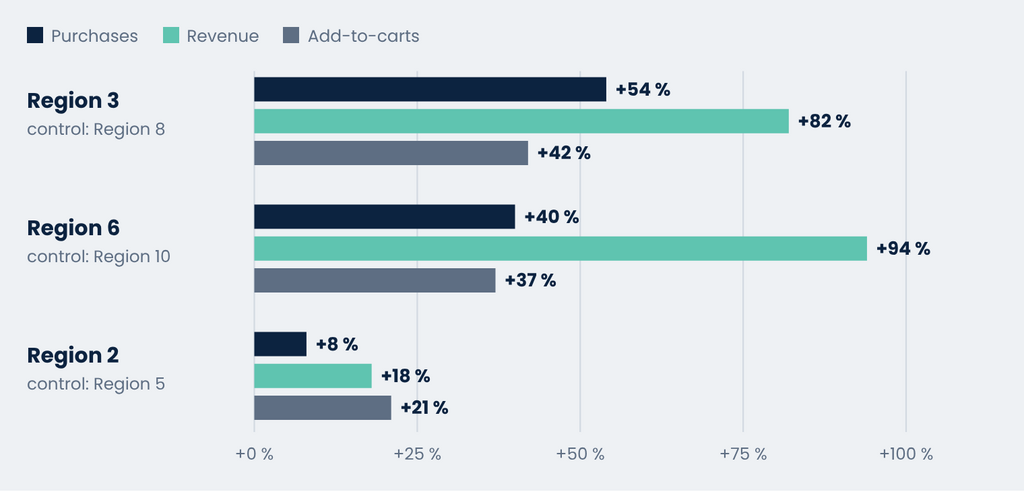
In all three tested regions, purchases during the campaign were above the forecast of what would have happened without it.

Purchases above the forecast across the three test regions

+27 %

Revenue above the forecast in the test regions

+46 %

Test regions with a lift in purchases, revenue and add-to-carts

3 of 3

So the investment made sense: it added sales during the campaign itself. The long-term effect of the awareness it built comes on top.

How far each test region came in above the model’s forecast during the six campaign weeks. The forecast is built on the control twin, so 0 % would mean no effect. The campaign didn’t only make people remember the brand. It changed what they did.

How far each test region came in above the model’s forecast during the six campaign weeks. The forecast is built on the control twin, so 0 % would mean no effect.

The campaign didn’t only make people remember the brand. It changed what they did.

Same campaign, very different efficiency

The lift was not the same everywhere, and that is useful too. A region that ranked second in the classic potential index turned out to be far less efficient for the budget than smaller regions.

6× cheaper per incremental purchase (iCPA) in Region 3 than in Region 2, in the same campaign.

Brand Lift showed that people remembered the brand. The Causal Impact study showed that they bought from it. Together they give a full answer to both marketing and finance.

Brand Lift too: The YouTube Brand Lift study in Poland showed a 5.2 percentage point lift in awareness during the same campaign.

Why you can’t skip the control region

We also evaluated the same regions the simple way: only against their own history, without a control twin. The results looked completely different.


Judged against its own history

Judged against a control twin

Region 6

+9 %

+40 %

Region 2

−3 %

+8 %

Verdict

“Barely worked”

The campaign sold

The regions without a twin, measured only against their own history, even came out negative. That doesn’t mean the campaign hurt sales there. 

Category search demand in Poland has been falling, and spring has its own seasonality. Without a control group you cannot separate the effect of the campaign from what the market is doing.

Without a control you can write off a good campaign as a failure, or celebrate growth that would have come anyway.

Where the lift didn’t show: three hypotheses, not budget cuts

In three of the four campaign regions without a twin, including Region 1 and Region 4, the two largest markets, the indicative measurement showed no increase, yet they took about half of the budget. 

You could read that as “advertising doesn’t work here”. We read it as a question to answer, and set out three hypotheses with the client.

The market is saturated

In Region 4 and Region 9 the brand sells far more than its search volume suggests. People who were going to buy may buy without more advertising.

Next step: Verify with Brand Lift or awareness research in these regions.

We weren’t loud enough

Region 1 has the most competition in Poland: the big fashion players have the highest search volume per inhabitant there. Our budget reached only a small part of the audience, at low frequency.

Next step: The answer would be a higher share of voice, not a cut.

The effect got lost in the noise

Large regions have high order volumes and big swings. A real lift of a few percent easily disappears, especially without a control region.

Next step: Measure longer, or test at city level instead of whole voivodeships.

Each hypothesis leads to a different decision: cut, invest more, or measure differently.

Next step: Test the hypotheses before moving any budget.

A clear answer for the board: the brand campaign had a measurable positive effect on purchases and revenue, so the investment made sense. On top of that, a view of where the budget worked hardest, and a plan for testing the regions where the effect still needs to be proven.

What the client took away

When a Causal Impact study makes sense for you

  • You can target the campaign geographically: regions, cities or countries.
  • You have daily data on purchases or another key metric by region. Well-configured GA4 is enough.
  • You have at least 2 – 3 months of history before the campaign.
  • You are willing to leave part of the market without the campaign as a control. This is the hardest part, and the most important one.
  • You have enough conversions per region, or a higher-volume signal to measure instead.
  • The campaign runs long enough and with enough pressure. For smaller regions, plan a longer measurement window.

Enough volume? With around a hundred conversions a month per region, only effects of +30 % and more show up. Measure brand search or direct traffic first.

How we do it

We buy brand campaigns as a certified Google Marketing Platform Sales Partner, and we build the measurement in from day one: choosing regions, designing the test, and an evaluation that stands up in front of a CFO. When something doesn’t work, we say so.

Want to know how much your brand really sells?

Free 30-minute check

Bring your latest campaign. In 30 minutes we’ll go through whether, and how, a Causal Impact study could be built on it. No pitch deck, no commitment.

Book 30 minutes 
RTB
26. 10. 2026