After meeting the 2022 target, we moved on to refine the optimal campaign effectiveness model in the following year.
The target for 2023: a significant reduction in the cost of sales compared to 2022. In addition to meeting this target, we also managed to achieve year-on-year growth - a great 48%!
At first we looked at the complete PNO (a Czech abbreviation of cost of sales – it is the inverse value of ROAS) for the entire website, then at the PNO per product, and then we switched to the combination that we use now. The client now has a detailed overview at the individual product level, which they can place in the wider context of the overall numbers.
In order for Direct to have all the data immediately available in a clear and understandable way, we also used the services of our partner Databy. On its website you can also find a case study of how we implemented Business Intelligence for Direct.
Read the BI case study (in Czech)
How we approached the cooperation
April 2022 - December 2022
In April 2022, we began increasing our media budgets to maximise effective new client acquisition through the website and the app.
Our hypothesis was clear - we felt there was an opportunity to leverage the performance campaigns significantly more building on other successful marketing activities at Direct. We continued this approach throughout May and June.

Starting in July, we began to focus more on performance efficiency in terms of individual products, and then in August we monitored cost of sales at the level of specific products. We continued to do this through September.
It has to be said that due to the cookie bar and therefore limited measurement capabilities, we could not continue to work with this model completely as we envisioned.
So, in October, we proceeded to track a single effective cost of sales for the entire website and app across all insurance products, which we continued with until the end of 2022.
January 2023
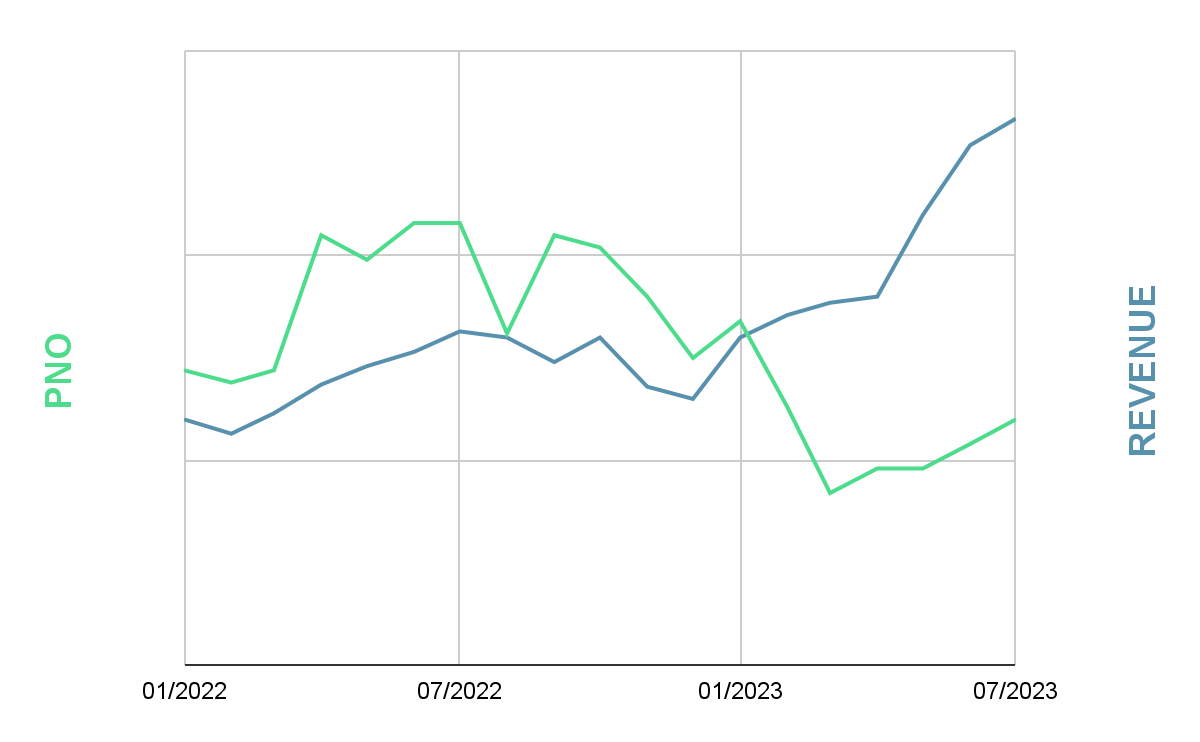
PNO = Cost of sales


